Thursday, April 24, 2014

Performance Case

Just a performance case I worked recently.  These kinds of things can be instructive for people with similar problems, or those who learn by playing along at home.  Here's my email, sorry for the copy paste without context.

 Please take a look at the email chain below as the starting point for this conversation.  At this point, we’ve reviewed four sets of performance data gathered over the last two months and have closely correlated a spike in large-IOP-size traffic to our latency spikes.  This spike is both in number and size of IOPS, exceeding 32,000 IOPS for 15+ minutes at a time.  There is no single volume driving the traffic, as it appears to be increasing dramatically across the board.  

Here is a summary of the performance data from Thursday 4/3, please note the IOP ramp up and associated latency:
Start Time
CPU Busy
NFS Op/s
Read Op/s
Read Lat (ms)
Write Op/s
Write Lat (ms)
Net Sent (MB/s)
Net Recv (MB/s)
9:53p
52
7,127
1,256
2.32
5,731
0.63
27
50
9:57p
67
13,637
5,396
19.96
8,076
110.09
145
81
10:05p
99
31,119
17,272
22.91
13,697
341.18
371
205
10:13p
99
32,311
22,519
8.4
9,739
229.45
621
200
10:24p
99
23183
12,819
7.21
10,261
143.16
348
260

And here is the data from Thursday 2/13.
Period
CPU Busy
NFS Op/s
Read Op/s
Read Lat (ms)
Write Op/s
Write Lat (ms)
Net Sent (MB/s)
Net Recv (MB/s)
9:09p
78
12,574
5,562
3.19
6,926
1.05
200
141
9:18p
98
27,771
17,291
4.7
10,347
24.29
571
312
9:29p
98
33,050
21,460
9.11
11,507
125.85
650
352
9:38p
98
34,149
22,813
11.28
11,216
530.9
647
345

One thing that stands out in the data is a large, sudden increase in 64k+ IOPS.  I’ve adjusted the table to include a row for 64k IOPS and have highlighted the relevant statistic.
FAS6280 Maximum IOPS

Read/Write Mix
Avg IO Size
100/0
75/25
50/50
25/75
0/100
64k
61,000
43,000
32,000
26,000
22,000
32k
68,000
48,000
36,500
30,000
25,000
24k
74,000
51,000
39,500
31,500
27,000
16k
80,000
56,500
43,000
36,500
30,500
8k
85,000
63,000
50,000
41,500
36,000
4k
90,000
66,000
54,000
45,000
40,000


  The workload mix appears fine for most of the day but experiences large-IOP-size peaks that are outside our guidelines and cause some pain (38,000 IOPS 1pm 4/5,  45,000 IOPS 11pm 4/4, 37,000 IOPS 11am 4/3) .   I’d also make mention that ~10% of IO to this system is misaligned, which hinders us from achieving maximum performance ROI.  Lastly, this system is achieving 65-85% dedupe ratios, which is fantastic space conservation but adds to the overall workload.

  As discussed yesterday, here are our options:
·         Short term steps:
o   Stagger workloads (Symantec, et al)
o   Disable aggr snapshots (done)
o   Stagger dedupe
o   Case open on daytime snapshot correlated latency (done)
o   Update Data ONTAP
·         Long term solutions:
o   Add new disk to passive controller and balance workload or

o   Shift workload to a different or new HA pair
How to convert from 7-Mode to CDOT

Here is a publicly accessible document on converting your old 7-Mode systems to NetApp's new operating system, CDOT.

https://kb.netapp.com/support/index?page=content&id=1013517

An excerpt:
Perform the following steps to convert from Data ONTAP 7-Mode to Data ONTAP 8.0X Cluster-Mode
  1. Disable 'Cluster Failover' and reboot the node to the LOADER prompt. Do not perform a takeover.
  2. Boot each node to the LOADER prompt and ensure that the following variables are set:

    To convert from 7-Mode to Cluster-Mode:
    LOADER> set-defaults
    LOADER> setenv bootarg.init.boot_clustered true
    LOADER>
      setenv bootarg.bsdportname
     
  3. Boot the node with this command:
    boot_ontap
  4. When the nodes are booting, press CTRL+C to enter the Boot menu.
  5. At the Boot menu, select wipeconfig on each node.
    *******************************
    * Press Ctrl-C for Boot Menu. *
    *******************************
    How would you like to continue booting?
    (normal) Normally
    (install) Install new software first
    (password [user]) Change root/user password
    (setup) Run setup first
    (init) Initialize disks and create flexvol
    (maint) Boot into maintenance mode
    (syncflash) Update flash from backup config
    (reboot) Reboot node
    Please make a selection: wipeconfig

ONTAP 8.2 Commands

Measuring Read Sequential vs Random

If you want to measure an existing workload's seq vs random profile in IOPS, there's a pretty simple way.  Run this command (diag mode): stats show readahead.  The part you care about will look like this:

Table 1
readahead:readahead:seq_read_reqs.4K:71%
readahead:readahead:seq_read_reqs.8K:80%
readahead:readahead:seq_read_reqs.12K:78%
readahead:readahead:seq_read_reqs.16K:70%
readahead:readahead:seq_read_reqs.20K:75%
readahead:readahead:seq_read_reqs.24K:75%
readahead:readahead:seq_read_reqs.28K:78%
readahead:readahead:seq_read_reqs.32K:76%
readahead:readahead:seq_read_reqs.40K:77%
readahead:readahead:seq_read_reqs.48K:81%
readahead:readahead:seq_read_reqs.56K:79%
readahead:readahead:seq_read_reqs.64K:98%
readahead:readahead:seq_read_reqs.80K:86%
readahead:readahead:seq_read_reqs.96K:0%
readahead:readahead:seq_read_reqs.112K:0%
readahead:readahead:seq_read_reqs.128K:0%
readahead:readahead:seq_read_reqs.256K:0%
readahead:readahead:seq_read_reqs.384K:0%
readahead:readahead:seq_read_reqs.512K:0%
readahead:readahead:seq_read_reqs.1024K:0%

The first part is garbage: what we care about starts after the period.  The "56k" number is the approximate size of the IOP, and percentage is how many of that size were sequential during your measurement.  Ignore the first whole part, and focus on the percentile.  Just a glace shows you we have at least 75% seq read IOPS averaged across the IOPS sizes. That's good enough for most performance profiling questions.  

I don't think this is particularly useful, but I was asked recently the read random vs sequential throughput measurement as well.  We can also calculate that (roughly) here.  Notice this IOP size count:

Table 2
readahead:readahead:total_read_reqs.4K:94346
readahead:readahead:total_read_reqs.8K:34333
readahead:readahead:total_read_reqs.12K:9669
readahead:readahead:total_read_reqs.16K:8533
readahead:readahead:total_read_reqs.20K:19922
readahead:readahead:total_read_reqs.24K:4563
readahead:readahead:total_read_reqs.28K:4069
readahead:readahead:total_read_reqs.32K:12009
readahead:readahead:total_read_reqs.40K:10299
readahead:readahead:total_read_reqs.48K:5949
readahead:readahead:total_read_reqs.56K:4908
readahead:readahead:total_read_reqs.64K:2675102
readahead:readahead:total_read_reqs.80K:234257

You guessed it.  Multiply the corresponding # of IOPS times the size beside it, multiply that by the percentage that accompanies that IOP size in the first table.  For example:

readahead:readahead:total_read_reqs.32K:12009
readahead:readahead:seq_read_reqs.32K:76%

Calculation 1: 32*12,009 = 384,288Kb

This is your total Kb throughput at that IOP size.

Calcuation 2: 384,288Kb*76% = 292,058Kb

This is the sequential throughput at that IOP size.  Do each calculation for each size, then add all the Calc 1's up and all the Calc 2's.  Finally, divide the sum of the Calc 2's by the sum of the Calc 1's, and you have the percentage of the read throughput which is sequential!

CDOT and Show Mount

FYI, NetApp has a quick workaround to get show mount to work.  From the ReadMe:

This tool provides 7-Mode functionality in Clustered Data ONTAP for the "showmount -e" command as it is executed by an application as a workaround tool until the official ONTAP fix in 8.3.

It is a set of scripts which needs to be copied to the client machines on which the 'showmount -e' command will be executed and hence replacin the original showmount command binary.

The steps to use this showmout wrapper:

1.Move the existing /usr/sbin/showmount to /usr/sbin/showmount_old. This is very important step.

2.Copy the files [NaServer.py, showmount.py, NaErrno.py, NaElement.py, showmount] from showmount_export folder to /usr/sbin.

3.Update the showmount file with proper username and password for the storage virtual machine access

4.Execute showmount -e

Note: Please make sure the LIF "Role" is data and "Firewall policy" is mgmt, when you create the LIF from CLI or If you use system manager to create LIF (storage virtual machine -> select the svm -> configuration -> Network Interface -> create ) and make sure to select "Both" in "Role" screen of the LIF

5.Check the results are coming then try with OVMManager.


http://support.netapp.com/NOW/download/tools/showmount_plugin_cdot/

CDOT 8.2.1 Summary

Take a moment to familiarize yourself with this CDOT 8.2.1 documentation.  There is a TON new and improved in 8.2.1 over 8.2, as well as some cautions.  I’ve highlighted a few here.

https://library.netapp.com/ecmdocs/ECMP1368924/html/GUID-45F85A02-114C-4192-8F1B-A4F50996D307.html

Features:
  • Support for FAS8000 series
  • V-Series feature now called “FlexArray,” a non disruptive on-the-fly licensable feature.
  • Support for qtree exports
  • Storage Encryption support
  • Support for direct attach E-Series configurations
  • Non-Disruptive shelf removal support
  • Log and core dumps available via http:///spi/
  • SQL over SMB3 non-disruptive operations support
  • VMware over IPv6 support
  • Offbox antivirus support
  • Health monitoring of Cluster Switches
  • Increased Max aggr sizes
  • 32-64-bit aggr conversion enhancements
  • Automatic Workload Analyzer, which assesses how the system would benefit from SSDs (Flash Pool)
  • Support for “Microsoft Previous Versions” tab on files (8.2 and later)

Cautions:
  • Some Hitachi or HP XP array LUNs might not be visible.  “In the case of Data ONTAP systems that support array LUNs, if the FC initiator ports are zoned with Hitachi or HP XP array target ports before the storage array parameters are set and the LUNs are mapped to the host groups, you might not be able to see any LUNs presented to the Data ONTAP interface“
  • NFSv2 not supported. Windows over NFSv3 not supported.
  • Verify management software versions are compatible.
  • First VLAN configuration may temporarily disconnect the port.
  • LUN revision numbers change during upgrades.  Windows 2008, 2012 interpret these as new LUNs.  
  • Dedupe space considerations and clearing stale metadata for upgrades.
  • Cautions for proper cluster and vserver peering methods
  • Cautions for proper vol move methods

Tuesday, April 15, 2014

Aggregate Snapshot autodelete_base

Interesting aggregate snapshot name: autodelete_base

The autodelete_base snapshot was created as a fix for BUG 263339: Aggregate snapshot autodelete is leaving me with no snapshots. The filer will automatically create a snapshot called autodelete_base at the aggregate level when a snapshot is removed as a result of autodeletion. This ensures that there is always a new snapshot in the aggregate after a snapshot is deleted.


https://kb.netapp.com/support/index?page=content&id=2011516&locale=en_US

Tuesday, April 1, 2014

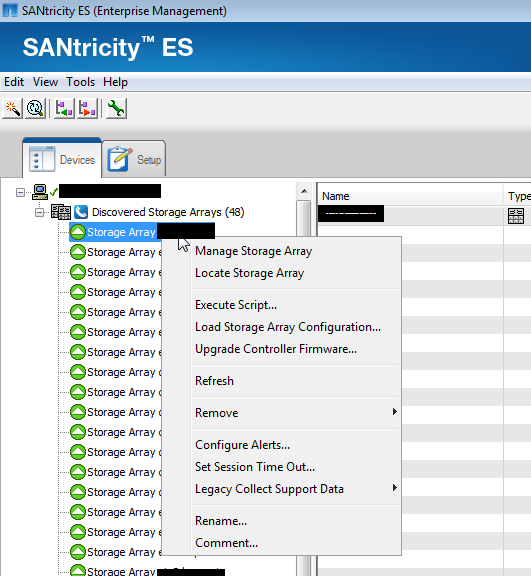
SANtricity Walkthough


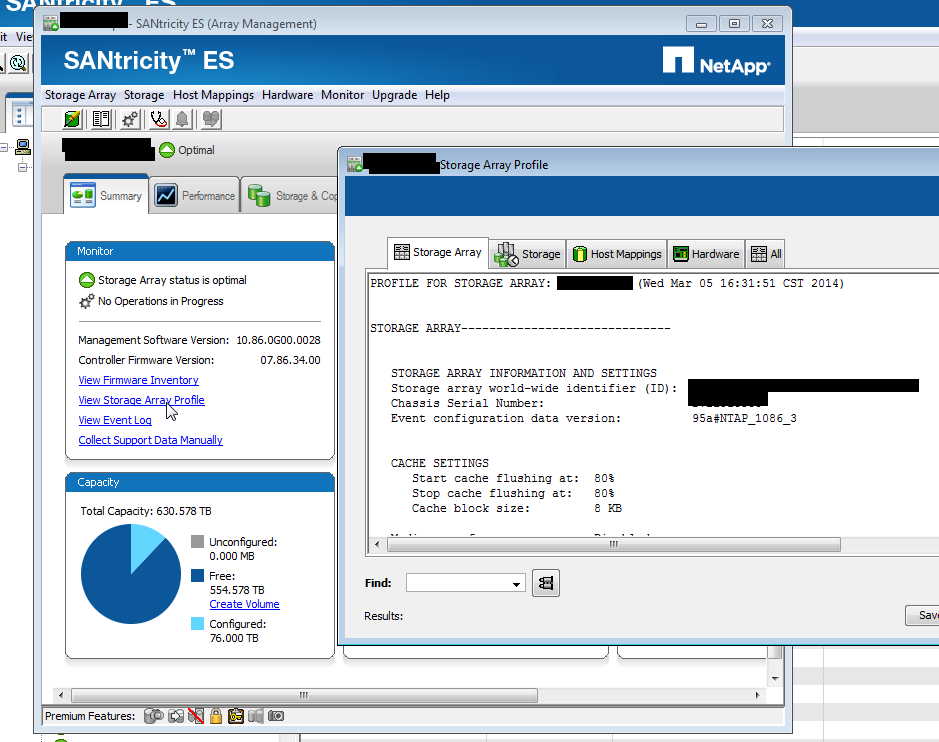
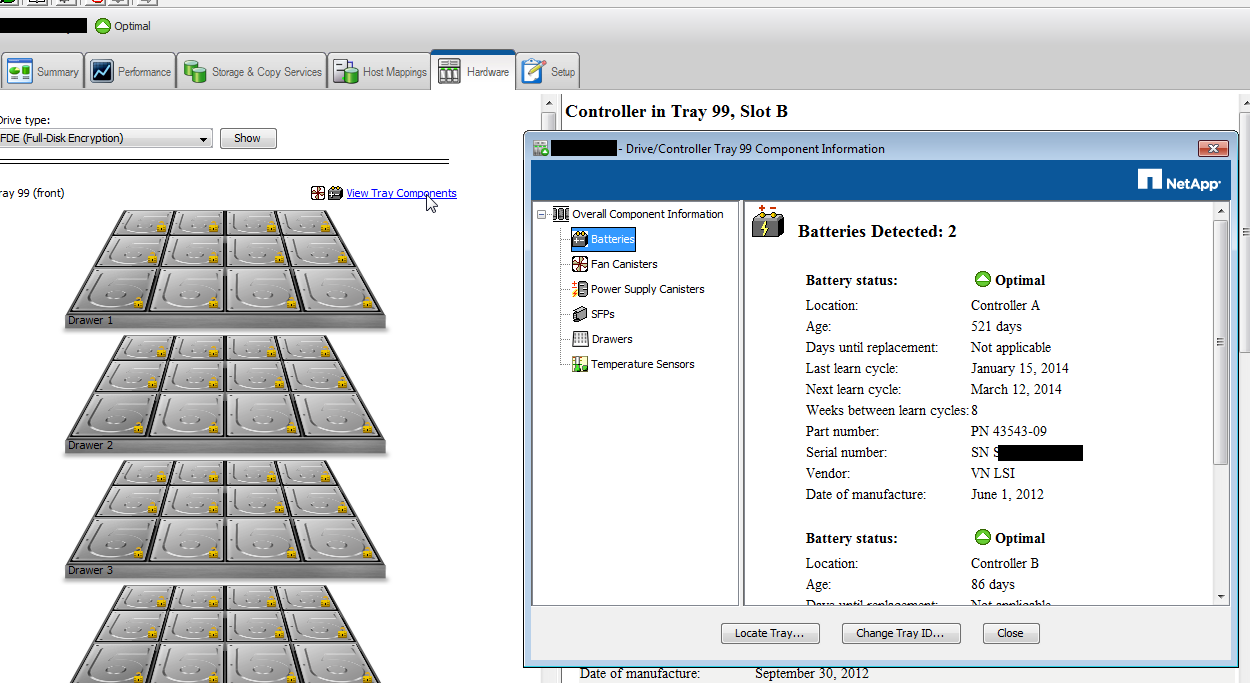
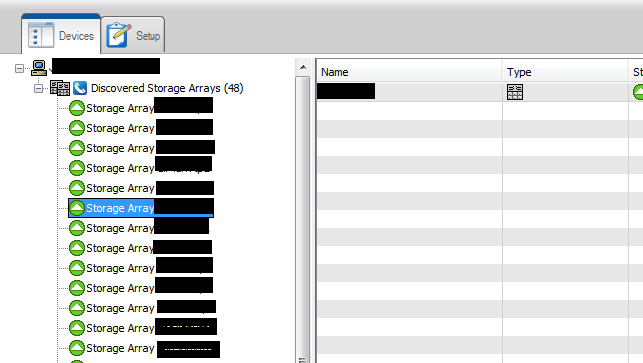
 Quick walkthrough for anyone unfamiliar with SANtricity.  Names have been changed to protect the innocent, I apologize for the mspaint job but hey, this is a free blog!  You get what you pay for!


1. SANtricity home page

2. Right click an array.  Click manage.
3. Click “view storage array profile.”  You’ll see the chassis SN. These are sometimes missing, sometimes strange combos of letters and numbers, sometimes 70xxxx like FAS systems  When we fix the environment, they’ll all be 70xxx.

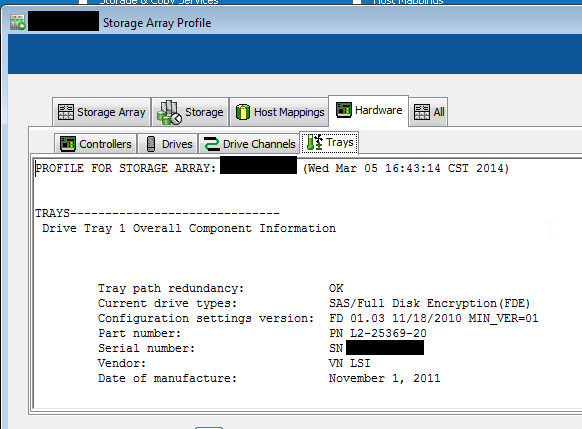
4. SANtricity tells you if the system is properly cabled:
"Tray path redundancy"


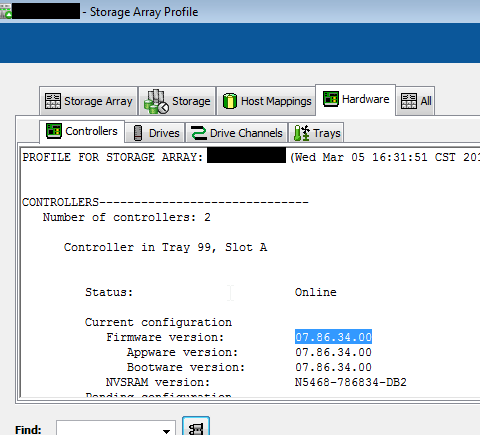
5. Click hardware tab.  You’ll see the controller firmware version.

6. Exit the view storage array profile.  Click hardware tab. 
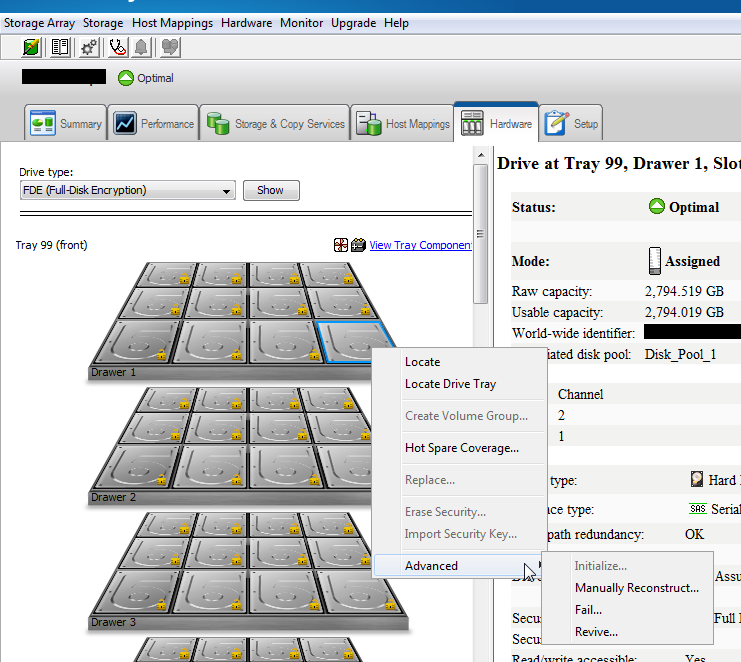
Right click a disk you see these options.  This is where you manually fail a drive.

Also notice the menu bar at top has changed: there are a ton of options up there, 
including performance monitoring.

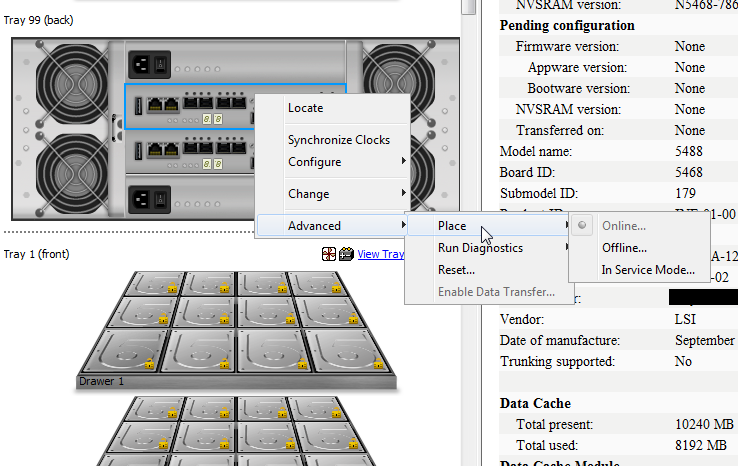
7. Scroll down, you’ll see the controllers.  Right click one, here are your options, 
like locate which blinks lights, or "place" gives you options to “fail over” the 
controller, reboot it, etc if it fails.


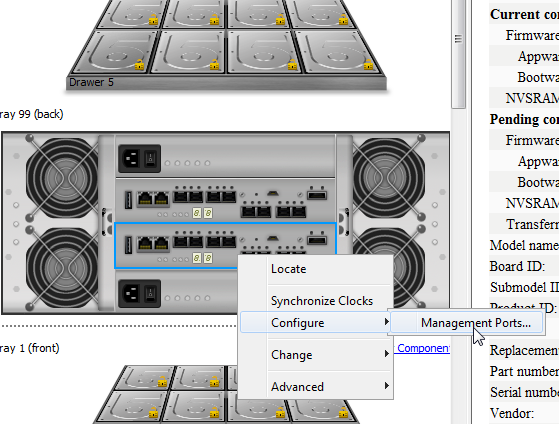
8. Configure lets you set the management port IP.


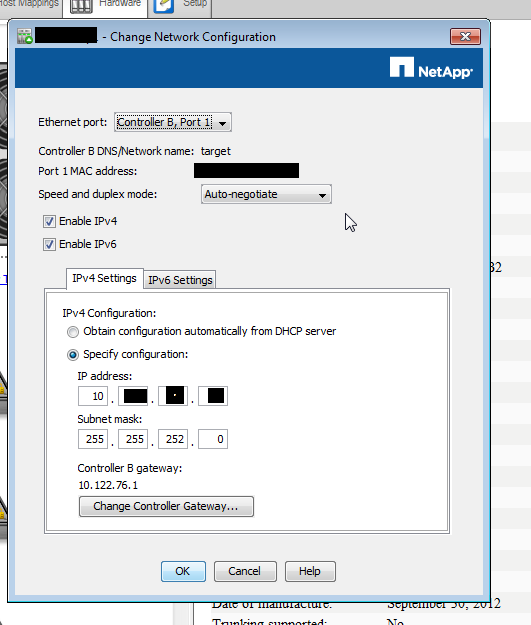
9. The port config window


10.   The tray’s components and their status

E-Series Notes


We've been digging into E-Series as fast as humanly possible, here are some of the basic things that have bee tough to flush out:


  • Impending drive failures: the best practice is to fail the drive manually immediately before replacing it
  • Upgrades:
    • Best practice is to update NVSRAM and Controller Firmware (CFW) at the same time
    • Watch out!  The SANtricity will start running checks and try to upgrade all of the arrays if you do this wrong.  Be careful.  Luckily, it should ask for the array password before upgrading, which gives you a chance to cancel.  
    • If you open the array, go to storage, right click the system, you'll find an "upgrade" option where you can update just that system.  Use this!
    • A precheck is run automatically to detect possible upgrade issues.
    • CFW upgrades are non-disruptive and should take 5-15 minutes per array
    • NetApp recommends not updating disk firmware unless you have a specific reason to
  • Changing array password if you forget it: https://kb.netapp.com/support/index?page=content&id=1013311&actp=search&viewlocale=en_US&searchid=1395157054885
  • Cabling document: https://library.netapp.com/ecm/ecm_get_file/ECMP1394868
    • Looks like each array model has a different cabling schema.
  • E-Series systems have default IP's on 
  •  Default Username: shellUsr, Default Password: wy300&w4