Sunday, January 30, 2022

2022 Economic Predictions

Let me introduce some of yall to the inverted yield curve and my predictions for the US economy.

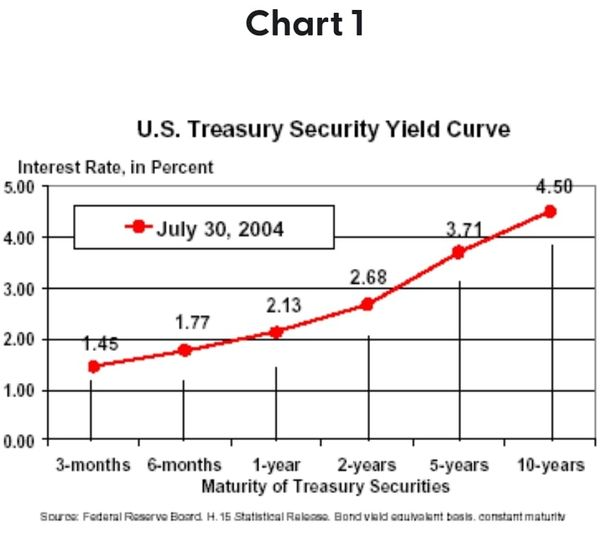
The yield curve is just a graph answering the question "If the government wants to borrow money for a short time or long time, what are the interest rates loaners will agree to?"

Normally, the graph looks like this. Loaners have a good idea what's gonna happen this year, so on the left, it's a relatively lower interest rate (a one year loan). But loaners don't know what will happen in 30 years, so they want a higher interest rate if they're gonna have their money tied up the whole time. Usually longer loans = riskier for the loaner, because they could have done lots of other stuff with that money.

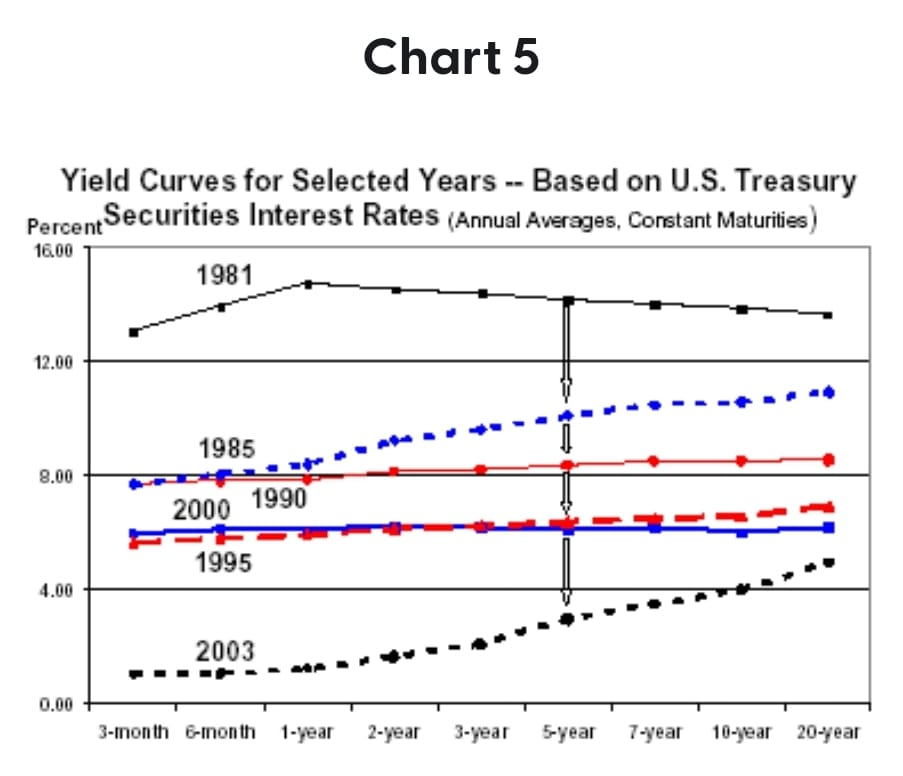
Now, over the past 40 years, interest rates keep getting brought lower by the federal reserve. You can see that every time there's a financial crisis or recession, the fed lowers interest rates and gives everyone more money. You might ask "well, why doesn't the economy recover and then interest rates return to normal?"

The answer is the American people don't want reality, they want free stuff. From hedge fund managers to retirees to welfare queens, everyone wants more money for less work. And lowering interest rates is one way to do that.

So every time interest rates go lower, when the federal reserve tries to move them back to normal levels, people freak out, the stock market crashes, a recession happens, people get laid off, and politicians yell at the fed, who lower interest rates again.
You can see that we are running out of room to keep playing this game.
The inverted yield curve is what usually happens right before a recession. Remember, on the left is "How high is the interest rate when the government wants to borrow money for a year" and on the right is "How high is the interest rate when the government wants to borrow for 3 years."

When people think there is a recession coming, they think the federal reserve will have to reduce interest rates. So they figure "Interest on long term loans should be lower, because rates are going to go down." It's called inverted because the left side is higher than the right side, which is the opposite of normal (see 1st graph).
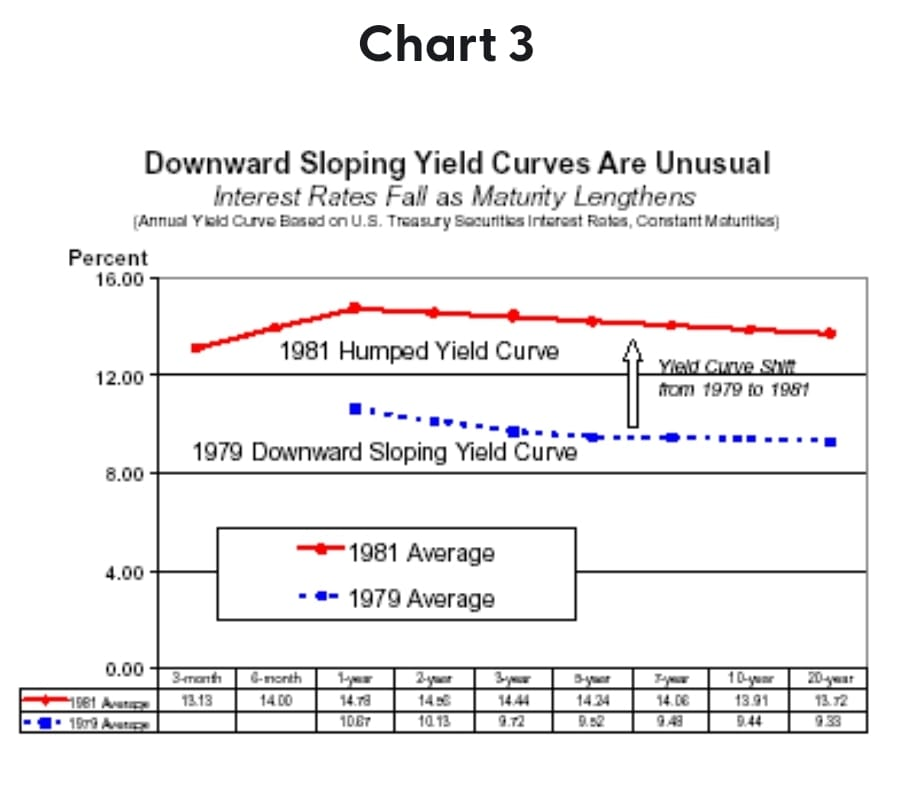
In 1979, they had inflation so high (13%) that everyone knew interest rates would go up (12%->18%) and also that this would cause a recession. That's why you see the blue line in chart 3 - left side of the graph is higher than the right.

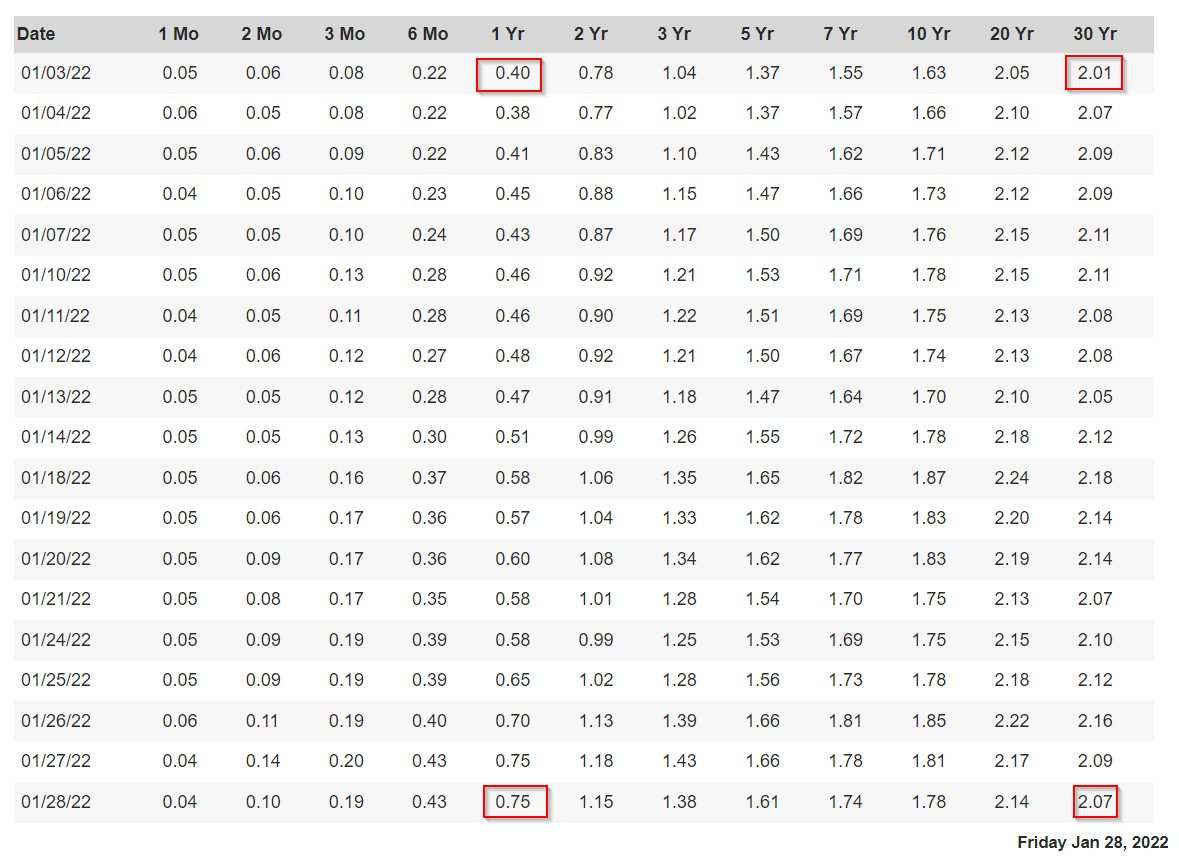
We are in the same boat now. Left side of the graph is 0.675%. Right side is about 2%. What we've seen so far is the left side shooting up and the right side staying the same. This indicates a recession is coming.

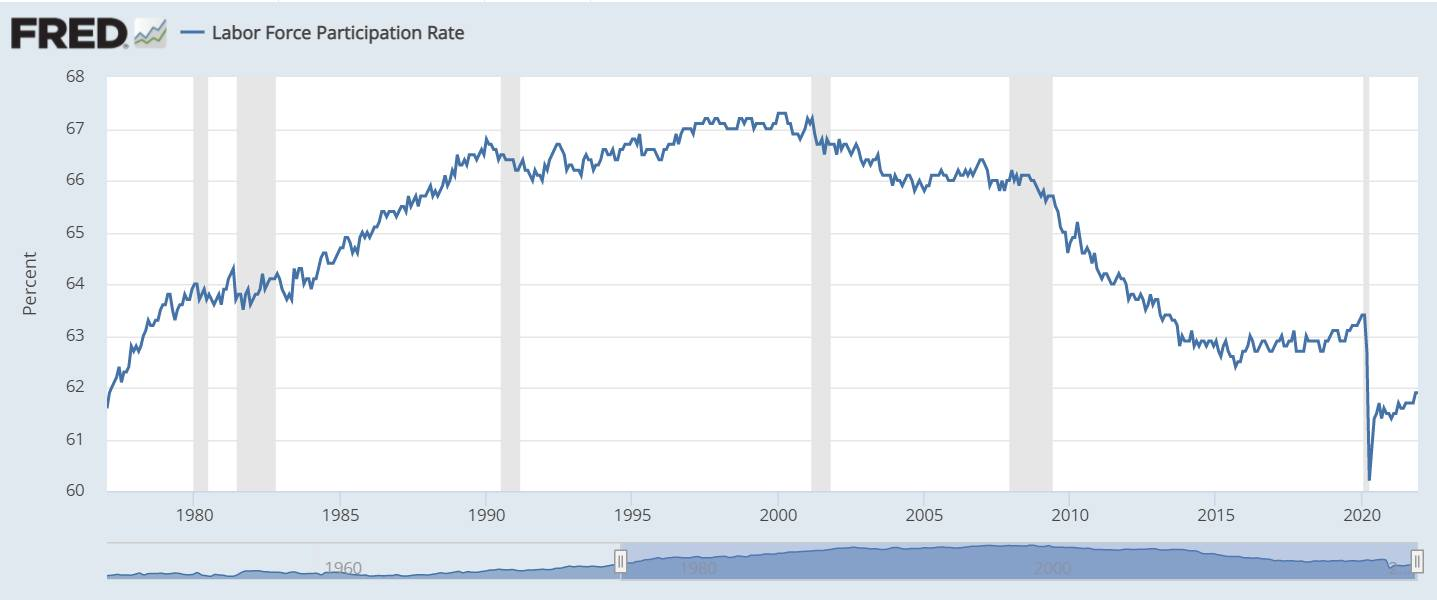
It's been true for a while that all of our economic growth was imaginary and just a result of free money from the fed. Tons of people are unemployed (see chart) but asset prices were skyrocketing. It's all fake.  And we could keep it going until something (inflation) forced the federal reserve to turn off QE and raise rates. And here we are.

So the fed is turning off the printers and raising rates. This crashes the stock market and causes a recession. It won't be enough to immediately stop inflation from increasing.

It's possible that the fed will be able to raise rates slowly enough, and sell assets slowly enough, that they are able to deflate the bubble and reduce inflation without causing a full blown freakout recession. But I don't think that'll happen, for a few reasons:

1) Every time there's a recession, the rate ceiling for how high interest rates can go before the market freaks out gets lower. Right now, folks think it's like 2%, and we can't get 10% inflation under control without rates far higher than that.

2) The federal debt is fucking huge (see chart), and it gets worse every day. As interest rates go up, the federal debt goes up (obviously nobody wants to raise taxes in a recession), so there's a limit to how high interest rates can go. Basically, in a democracy, inflation is harder to blame on the government than tax hikes or spending cuts. So we will get a basket of the worst of all worlds - high inflation, cut spending, higher interest rates, probably higher taxes etc.

3) If we don't cut spending and raise taxes, it sends us further down the road toward an economic crisis like we've never seen, caused by the world losing faith in the US dollar as our debt to GDP ratio heads towards 3:1. A that point the government's interest rates skyrocket, the fed loses control, and hyperinflation is the only way to pay off the government debt and stabilize the situation.

Some of my recommendations for this year:
1) Some amazing tech stocks are down 50% already. Maybe scoop them up and hold for the long haul.
2) Stay as liquid as you can, but don't hold any cash at all. If you want something safe, VTIPS or STIP are inflation protected and are a good bet.
3) In a recession, utilities and insurance perform well. Everyone keeps paying. However, I'm unsure if utilities will be able to raise rates to keep up with inflation.
4) Do not panic sell. Just hang on through the ride.
5) Commodities tend to do well, because they can easily raise prices to keep up with inflation. But I don't know much about this space.
6) Cut your spending NOW and prepare. Turn off/pause all those monthly subscriptions, stop eating out, save your money. There are layoffs and brutal interest rates in the future.
7) Get the hell out of cryptocurrencies. They are not a hedge against inflation, they're a place that excess money goes. And pretty soon, there won't be any excess money.
8)This is the time to buy a house, before interest rates skyrocket. But there's reason to think house values will decline over the next few years. So you're gonna overpay and might be underwater at first.
9) Get out of small cap stocks. They get crushed during modern recessions because people sell mutual funds and there just aren't enough buyers.

All of this assumes the fed doesn't freak out and cut rates/resume QE. Which I just don't think they can do. But short term thinking has been the name of the game for so long, perhaps they'll find a way to forestall the inevitable again.

Saturday, March 2, 2019

Tensorbook Premium Review


For a lightweight work laptop, I've been using a Surfacebook 1 for a long time.  It has a great keyboard and display, plus it's light.  But I've had some serious problems with it, for one the performance is so bad that sometimes outlook just crashes.  The other problem is storage performance: the surfacebook has an awful SSD, just terrible latencies and throughput.

The bigger issue has been that the tablet-to-keyboard connection frequently disconnects, leaving you unable to control your laptop until it re-connects. Sometimes that would happen a lot.  I had this issue with the first two Surfacebooks MS sent - the third has not had it, to my relief. 

Now that I'm really getting into ML for my graduate degree, I've found the Surfacebook just fails out of some of the notebooks I'm running, and others take 20+ minutes.  So I decided it was time for an upgrade!

I settled on the Tensorbook Premium, since it had the best specs I could find anywhere at the $2800 price range, and I wanted to gain more Linux experience. It matched the hardware and price of the MSI system and comes with a pre-installed Ubuntu system, with all the drivers, CUDA, etc validated and worked out.  I had spent hours trying to get my Surfacebook to work correctly with CUDA and Tensorflow, to no avail.  Here are my gripes so far:
  • hard drive doesn't come encrypted?  And if you want to encrypt it, you'd have to wipe the image in order to do so.
  • no jupyter, anaconda, python installed
  • battery lasts 2 hours at best
  • It has a numberpad, so you spend 90% of your time on the left hand side of the screen, where the actual keyboard is.  Why is this so wide?
  • Capslock has a delay, so typing is a giant pain.  Typing a case-sensitive password is a nightmare (and no, I will never learn to use the shift key!  Old habits die hard).
  • The capslock key doesn't have a light to indicate on or off.
  • battery drivers have no idea how much time is left, and the % does not match the time
  • gets hot and loud
Performance:
  To test performance I used a Jupyter notebook from my grad school class that grabs 2000 pictures of cats and dogs, converts them to greyscale arrays, and then trains a DNN and a CNN.  The Tensorbook did it in 62 seconds and hit 1.6GB/s write to disk.  WOW!

Here are the Tensorbook Premium results:
Processing image files to 512x512 color or grayscale arrays 
  • Image processing run time: 44.2s 
  • Image processing CPU/GPU/RAM bottleneck time: 35.7s 
  • Image processing Disk IO bottleneck time: 8.5s
Overall notebook run time: 62.2s

And here are the Surfacebook results:
Processing image files to 512x512 color or grayscale arrays 
  • Image processing run time: 401.3s 
  • Image processing CPU/GPU/RAM bottleneck time: 129.5s 
  • Image processing Disk IO bottleneck time: 271.8.5s

Overall notebook run time: 1,078s (18 minutes)


Surfacebook hit 200MB/s read at one point. And 60MB/s write while it's doing np.save on all those scaled files. Tensorbook hit 1,600MB/s write during the saves and only tapped out the GPU during the NN training.

Implications for data storage
1) 1.6GB/s from a local NVMe SSD is amazing
2) Lots of metadata ops (read file names, edit file names, list directory)...these types of ops might run into scale issues on servers linux file systems.
3) For the image processing, there is a lot of read and write to disk.  It represented about 1/4 of the runtime for my Tensorbook and 3/4 of the time on my Surfacebook.  Throughput matters!


Monday, January 7, 2019

Pandas Part 2 (Ongoing)


If you want to print the name of a column, just do df.columns[]

To print a column, try df.columns[<"name of column">]

To print the number of rows/columns, len(df.rows) or len(df.columns)

to identify the class/type of object, type()

Simple iteration: for i in range (, )

df_python=survey_df[['column name1', 'column name 2']]

to print out unique values in a column: int df[col].unique()

If you want to manually create a dataframe, do this:

df= pd.DataFrame(columns=['col1', 'col2'])
df['col1']=['data','data2','data3'] or
df['col1']=[84,253,3]

If you want to create a new column that transforms existing text values into a numeric value, do this:

=pd.merge(,[["name of column 1 to bring", "name of column 2 to bring"]],left_on="which column from df 1 to match",right_on="which column from df 2 to match",how='left')

Get rid of columns that aren't helpful: del df['column_name']

to assign a value to a specific cell in a df, df.ix[0, 'COL_NAME'] = x

Monday, May 21, 2018

Ethical Journalism in an Age of Mass Murder

For a long time, there has been strong (overwhelming?) evidence that the media has influence over the number of people who commit suicide.  Called the "copycat effect" or "media contagion," it's basically the idea that when when the media reports on suicide, they influence more people to kill themselves.

"Research into suicide coverage worldwide by journalism ethics charity MediaWise found clear evidence that the attention given to the circumstances surrounding a celebrities who kill themselves is more likely to incite copy cat suicides."

For this reason, the media has best practices for suicide reporting: don't even cover suicides unless it's a noteworthy person, don't glamorize or romanticize it, etc.  This dedication to language best practice is fairly sophisticated - for example, the Associated Press even recently recommended against using the phrase "committed suicide."

---

Three years ago, Malcolm Gladwell published an article that posited a similarly intuitive (even obvious) theory on mass shootings.  I'll just quote his main point here:

"But Granovetter thought it was a mistake to focus on the decision-making processes of each rioter in isolation. In his view, a riot was not a collection of individuals, each of whom arrived independently at the decision to break windows. A riot was a social process, in which people did things in reaction to and in combination with those around them. Social processes are driven by our thresholds—which he defined as the number of people who need to be doing some activity before we agree to join them. In the elegant theoretical model Granovetter proposed, riots were started by people with a threshold of zero—instigators willing to throw a rock through a window at the slightest provocation. Then comes the person who will throw a rock if someone else goes first. He has a threshold of one. Next in is the person with the threshold of two. His qualms are overcome when he sees the instigator and the instigator’s accomplice. Next to him is someone with a threshold of three, who would never break windows and loot stores unless there were three people right in front of him who were already doing that—and so on up to the hundredth person, a righteous upstanding citizen who nonetheless could set his beliefs aside and grab a camera from the broken window of the electronics store if everyone around him was grabbing cameras from the electronics store."

The media's endless coverage of every mass murder is driving copycats...and no one is doing anything about it.  It's not that journalists individually know this and are OK with it - they're just trapped in a system that is designed to drive clicks and views, and endless coverage of mass murder is a profitable way to do that.  A better summary of this situation is made here.

We now have a stack of voices naming this out loud in the Washington Post, Federalist, Criminologists, Ethical Journalism Network, etc.

---

So, what to do?  There are many great, thoughtful proposals out there - here's one from the Columbia Journalism Review.  The gist is that we can still responsibly cover mass murder - driving awareness, resources, policy change, prevention, and free flow of information in our democracy - but limit the media contagion.  We can do this by not printing the person's name, picture, manifestos/ravings/message, or comparing kill counts.  Phrases like "deadliest shooting spree" or "gunman" create a morbid romanticism, even a gamification in a dark mind.

Another proposal is to call on the media to de-monetize coverage of mass murders.  Selling ads by spreading media contagion is a bit like selling soup prepared by Typhoid Mary.

We need a website written by respected authorities in journalism laying out these proposals. We need politicians to use their voice to raise the issue, we need grassroots boycotts for advertisers who buy ads on media that refuse to report responsibly.

Our journalists generally feel their work is a vocation, not just a job.  They're proud of the role they play in the nation's well-being and advancement, and I'm sure it's horrifying for a person to realize they're part of this morbid feedback loop - more murders, more coverage, more murders.  Just conjecture here, perhaps part of the reason journalists are so ardent in their support of gun control as a solution to mass murder is that they're aware of their role, and are looking for a scapegoat to restore their feeling of "the good guy." 


Monday, May 7, 2018

Poverty and Geography in Minneapolis


It's an open secret that concentrated poverty is at record levels and getting worse.  This has been occurring in tandem (it's a feedback loop) with a new structural unemployment that have stayed at bleak 40-year highs since 2012.

The short story is that even as our economy has improved and Americans in general have gotten wealthier, the bottom 20% or so have been left behind.  You can see that from 2000 to 2018, 5% of workers dropped off the face of the Earth. This is awful. 

Concentrated poverty is a big contributor to this - clustering poor people together means, as Ed Sheeran's song says, "the worst things in life come free to us."  Poor communities have higher crime, substance addiction, worse public services, less social capital, less opportunity, worse education, basically a basket of awful variables that form a Feedback Loop of Awful (let's call it FLA).  

This blog post is about geographic isolation - one of the variables in the FLA.  Of course, access to the rest of the city is valuable, so the cheapest housing is the least accessible.  I've now lived in the poorest, most violent, and highest minority part of Minneapolis for a year, and a few things have become empirically obvious to me. 

Take a look at this map.  To the bottom left you have the richest suburbs with the corporate jobs.  To the bottom right you have the airport.  To the right of the S in Minneapolis you have the U of MN, and to the left of the M in Minneapolis you have "the hood," North Minneapolis. 

Here's a closer look at the city and North:

Above the words "Near North," and to the west of 94,  is where the hood begins.  We affectionately refer to it as the "North."  It takes up the entire area to the northwest.  A few local knowledge things to note:
  • To the east of the river there are tons of resources, amenities, culture.  The North is separated by both a 10-lane highway and the Mississippi River. 
  • There is a train that goes from downtown to the airport.  It never reaches North.
  • 94, between the words "North Loop" and the junction with 35W, is forever deadlocked.  This short stretch of highway adds 15 minutes to your trip, every time.  This means any trip from the North to anywhere south or east is at least a half hour - cutting North off from the south and east of the state.  This is not true of land east of the river, where 35W runs north and south smoothly. 
  • There is a stretch of no-man's land between 94 and the Mississippi that is in hospitable.  It's industrial and ugly.  It's basically a DMZ to separate the rich and poor.
  • To get from the closest part of North to downtown is eminently unwalkable.  First you have to cross an intimidating, rusty concrete bridge (take a look below...yikes) across 10 lanes of I-94, and then 7 blocks of nasty, noisy, windswept industrial buildings before you reach downtown.  Again, a DMZ to separate the rich and poor.
What all of this combines to is isolation - concentration of poverty.  Some suggestions:
  1. Beautify the overpass bridge and the trip to downtown.  This would be cheap and easy...protect the pedestrians from the wind and noise of the overpass, repair the sidewalks, plant trees, set lighting, and incent those who own the industrial buildings to slap on a new coat of paint every once in awhile.
  2. Finish the train track across, into North.
  3. Incent walkable business and retail in the no-man's land. 
  4. Improve and expand local streets with a north/south traverse in mind. 
  5. Figure out some way to improve the deadlock on 94!


Sunday, February 18, 2018

R Syntax Explained

Aggregate: This is used to apply a function (like mean) across a data set that is subset according to your needs.  For example, if you have a table of car sales details and prices (called mydata) and you want to know average sale prices, you can't just average the entire price column: you need the average price for each type of car.  Let's say your table has these columns: make, model, and price.

Aggregate takes a few inputs.  The first item is the dataset you care about: in this case, the table mydata, but specifically the price column.  Second item is a list of what subsets you'd like to create.  For example, we want to subset every row that matches "Ford" and "F150" and average their price.  So our second item is what categories we want to break the data out into: in this case, we want to see every unique combination of make and model.  The last item is the function we want to apply to the subset: average, median, etc.

result <- aggregate="" by="list(mydata$MAKE," mean="" mydata="" p="">

Filter and Select:  One of my favorite combinations. 
Filter takes two inputs: your dataset, and how you'd like to subset it.  So first input is our table mydata, easy enough.  Second input is a test: we give it the column Make, and test the values to see if they equal (==) Ford.  If the row's Make column contains Ford, filter will keep that row.  Otherwise, it's tossed. 

Select then is being given the result from filter.  Filter has snagged every row from our original table (mydata) and includes every column.  In other words, mydata started with columns make, model, and price, and filter also has all those columns. 

Select takes two inputs: one is your complete data set, the other is the column(s) you want to keep.  In this case, we want to keep the price column.  So this command eliminates every row that isn't a Ford sale and gives you a 1-column table of the prices of those Fords. 

In other words, the command below answers the question "give me just the prices from every Ford sale in the table."

select(filter(mydata, Make=='Ford'), Price)


Native dataframe manipulation: Sometimes you don't need to use commands like filter or aggregate to get the subset of data you want.  Let's say you have a 1-column table (let's call it car_returns) of the prices of all the cars that were brought back from a customer and had to be refunded.  How would you identify the make and model of the cars that were returned, just from the price?   So let's say the question is "give me all the rows (including make, model, and price) from my original table (mydata) that match these prices."

In general, you can subset a dataframe with a [] after the name: mydata[].  Inside the bracket, we'll need to pass two pieces of information: first, what column in mydata will correspond to the values in car_returns?  Obviously, price.  Now, we aren't comparing mydata's price column to a single price: we need to compare it to all prices that are in the car_returns table.  So we will use %in% to say "we want all the rows from mydata where Price equals one of the values from car_returns." 

mydata[mydata$PRICE %in% car_returns, ]

The other thing you'll notice is the comma after car_returns.  What's going on there is that we are comparing all the values of the column Price.  If we wanted to compare and subset based a row, we would put that after the comma.  For example, if we just wanted the Make of the car, we could do this:

mydata[mydata$PRICE %in% car_returns, mydata$MAKE]

Tuesday, January 23, 2018

Dahua IP Cam Setup

  1. Power: this thing doesn't come with a power source.  Seriously
    1. PoE or 12V input.  Do not do both!
    2. If your camera is outside, do PoE.  Look for something like this to boost your power: Single Gigabit Port PoE+ Injector – 30W – 802.3at https://www.amazon.com/gp/product/B00B4H00EO/ref=oh_aui_detailpage_o00_s00?ie=UTF8&psc=1 
    3. If you're going to do 12V
      1. BV-Tech DC12V 1A UL-Listed Switching Power Supply Adapter for CCTV - 5 Pack - Black
  2. Connecting to your camera
    1. Connect the camera via ethernet to your router/switch
    2. IE works OK but has issues.  Use chrome, it will prompt you to download and use a specific app.
    3. There appears to be no default IP - it's DHCP.  So log into your router and see what IP's are connected to it.  Mine always landed at 192.168.1.14 or .15.
    4. Open a browser to http://
    5. Default password is admin/admin

  1. Basic Setup
    1. Change the password:
      1. System | Account | click the pencil under "modify" | check "modify password"
    2. Connect to wifi:
      1. Network | wifi | check "enable" | double click the correct network and put in password
    3. Set the wifi IP address:
      1. Network | TCP/IP | At "ethernet card" click the dropdown and select "Wireless" | click the "static" button" | enter an IP address that you would like this camera to live on permanently | Click Save
      2. Set a new name for your device - something like "garage" or "front door" | click Save
      3. open the browser to your new IP address
      4. Unplug the ethernet cable
    4. Upgrade to latest code (very important if you don't want to get hacked)
      1. Find your device's latest firmware at https://dahuawiki.com/Firmware_Search_Tool/IP_Camera
      2. Unzip the package
      3. My firmware file was called DH_IPC-ACK-Themis_EngSpnFrn_N_V2.400.0000.15.R.20170804.bin
      4. System | Upgrade | Browse | Select the firmware file
      5. Click upgrade
    5. Set System Time
      1. System | General | Date&Time | Set your GMT time | Save
      2. Set DST here if you want.
  2. Advanced Setup
    1. Enable HTTPS (this is really important, it encrypts your connection to your camera)
      1. Network | Create | fill in all the boxes | change duration to 5000 days | click save
      2. Click install | Click download | Click save
      3. Check the box for "enable HTTPS" | Click save
    2. I set frame rate from 30 to 10 and enabled smart codec. https://www.dahuawiki.com/News/H.264_Plus_vs._H.264

Monday, December 18, 2017

Bandcamp, Music and Android

Here's a quick walkthrough on how to download music from bandcamp.com into your android phone.  First, you'll need to download an unzip app - Easy Unrar is free. Find it in the app store (Google Play) and download it.

I'll throw red dots on these screenshots to make it easy for you to follow along.


Next, get your download code and click on the link - for example, https://hopehymns.bandcamp.com/yum.  Input your code and click next.


Now click "here's how"

Click the second "Here's how", then select your file type (I used MP3 220, but I'm not a music expert so YMMV).   Then click download.


Great!  Your music is downloaded.  Now we need to unzip it.  Open Easy Unrar and click the "Download" folder.


If you've had your phone awhile, it might be tough to wade through all the downloads and find your album.  So click on the sort button on the upper right.


Choose sort by file size, large to small.


Since your album is probably more than 100MB, it should be near the top.  Here you can see Hope Hymns, the album i want.  Check the box and click Extract.


Check this box and click extract as well.


 OK - good news and bad news.  Bad news is you're not done, good news is you're almost done.  Now we need Google Music to rescan and discover your unzipped album files.  Open up the Settings app and click on Applications.


 Now find and click Google Play Music


Almost done!  Click Storage


!Important!  DO NOT click "Clear Data."  DO click "Clear Cache"


Now reboot your phone, open up Google Play Music, and you're done!  Enjoy.

Thursday, September 21, 2017

Pandas

This is just a running list of useful things about Pandas as I learn.


If you have data coming in from a .csv, use this: df=pd.read_csv('file.csv')

If your dataframe has strings and you want them to be numbers, use this: df.column = pd.to_numeric(df.column, errors='coerce')

If you have date/time in linux epoch format, you can convert using this: df['date'] = pd.to_datetime(df['date'],unit='s')

If you want to index on select columns: df.ix[:,:2]

df.describe() gives you min, max, avg, mean, percentiles, and std

df.groupby([column.other]).mean()

df[column.other == ]


Grab specific columns by name: df1 = df[['a','b']]

data.iloc[:, 0:2] # first two columns of data frame with all rows

this will square each cell, skipping the first column.  df.iloc[:,1:7]=df.iloc[:,1:7].apply(numpy.square, axis=0)

great link on managing jupyter: https://www.datacamp.com/community/tutorials/tutorial-jupyter-notebook

Great guide to pandas: http://www.lining0806.com:1234/pandas/Pandas%20DataFrame%20Notes.pdf

https://www.shanelynn.ie/select-pandas-dataframe-rows-and-columns-using-iloc-loc-and-ix/
https://www.youtube.com/watch?v=POe1cufDWFs

Some images you can ignore:


Thursday, March 30, 2017

Rancher Setup Basics

A client asked recently how SolidFire can integrate with Rancher.  I had a few RHEL servers available, so I'm going to set up Rancher on RHEL.  Here are the first steps:

Install a supported version of Docker (align compatibility for Docker, K8s, and Rancher): curl https://releases.rancher.com/install-docker/1.12.sh | sh

sudo service docker start

sudo docker run -d --restart=unless-stopped -p 8080:8080 rancher/server

Alright, let's pause here.  What did we just do?  First, we installed Docker.  Docker is the software that enables you to easily download, create, run, and manage containers.  Next we made sure the docker service was running.  Last we downloaded a container that will run the Rancher software.  At this point, you should be able to reach rancher's gui at :8080.

So let's get K8s and Trident up!  First we need a place to deploy K8s.  Click Infrastructure | Hosts.

Click add host.


And then save

Then enter the IP address of the server that will function as a host for containers.  Follow the instructions to copy-paste the command into a console on your new host server.


Done!


https://docs.rancher.com/rancher/v1.5/en/installing-rancher/installing-server/#single-container

Why Rancher: http://rancher.com/beyond-kubernetes/ 

Tuesday, March 28, 2017

Understanding SolidFire Capacity

To calculate the effective capacity available, follow this formula:

  • Error Threshold (#3) minus Used Capacity (#1) = Available physical space
    • In the example below, 86.24TB - 48.41TB = 37.83TB
  • Multiply Redupe Ratio * Compression Ratio, then divide by 2 (for Double Helix)
    • In the example below, (1.81 * 1.79)/2 = 1.62:1
  • Multiply the results of (a) and (b)
    • 37.83TB * 1.62 = 61.29TB

*This calculation assumes the current rate of dedupe and compression will continue
*This calculates capacity until the Error Threshold is reached, not the Total Capacity.

From ActiveIQ, our cloud monitoring tool:

  1. Used Capacity.  This is the capacity physically taken up on disk by data.  After dedupe, compression, and double helix occur, this number is the end result.
  2. Warning Threshold.  This is an adjustable alert threshold to alert that you’re approaching the Error Threshold.
  3. Error Threshold.  This is the point after which the system cannot rebuild the second copy of data after a node loss.  This is calculated by subtracting one node’s physical block capacity from the Total Capacity.
  4. Total Capacity.  This is the raw physical space on disk.  In this example, 1.92TB * 9 SSD’s * 5 nodes = 86.42TB.

From the SolidFire GUI:
      5. Block Remaining.  This is calculated subtracting the Used Capacity (#1) from Total Capacity (#4).
      6. Block Capacity until Warning.  This is calculated subtracting the Used Capacity (#1) from Warning Threshold (#2).


***Bonus***

       7. In ActiveIQ, under Reporting | Cluster Efficiency, hover over the graph to view the dedupe and compression ratios.  In this lab system, 1.81 * 1.79 = 3.24:1

Setting up PowerShell for SolidFire


A simple Guide to setting up PowerShell for SolidFire.
  1. Enable PowerShell
  2. Download SolidFire PowerShell toolkit 
  3. Unzip the toolkit
  4. Navigate to PowerShell-master\PowerShell-master\Install\ and run SolidFire_PowerShell_1_3_1_4-install.msi 
  5. Done!

Tuesday, March 7, 2017

Trident in Action

Some screenshots of NetApp's dynamic storage provisioner for K8s!  In this case, we're using OpenShift on SolidFire.


Saturday, March 4, 2017

OpenShift, Docker, and Elasticsearch

***This is part of an ongoing series I call "Mode 1 Storage Guy goes to a Mode 2 World."  I'm not an expert (yet), YMMV.***

There are already many good setup docs for Elasticsearch on OpenShift, like here and here.  So what I'm going to do is flush out the concepts so those instructions make more sense.

OpenShift

OpenShift has a concept of a project.  This is how they provide multitenancy.

Next is namespace, which is similar to a project. 

Next is the image.  An image is a pre-packed container probably with an application installed, like MongoDB or JBOSS.  You can create new images by installing an application into a container and saving that container.  The image concept is analogous to a VM Template: you keep it updated and deploy fresh containers from it.

A stream seems to be a set of evolving images: for example, when you download the latest CentOS, you're not asking for a specific version, just the latest version.  The stream is the set of successive images that you get the latest from.

Application.  This is the normal definition of an application, however in the context of containers, it's good to think about the application as separate from a container

The catalog is a view, a view of the images held in the registry.

The registry is merely what OSE calls the collection of images, held in a folder.

A Pod is the OSE equivalent of a container

A deployment is the mechanism that manages where, how many, and replication on pods for a given application.

Persistent Volume Claim (PVC): In OpenShift, this is a request for storage.  It can sit unfulfilled.

Persistent Volume (PV): When you create a PVC, and then match it to a real LUN/Export, you have a PV.

Don't panic if you see the word "cartridge."  That's just British for container.

Some notes:
openshift's gui is very foreign. Take some time getting used to it.
Unless you're an old linux admin, you're going to need to take the linux learning curve seriously. You'll really need to brush up on vi, ls, cat, curl, and wget.
The & symbol is your friend.  For any command that appears hung (but isn't hung, it's actually running) like "docker run ", throw an '&' at the end and I betcha it'll give you your prompt back. 
I had no luck connecting to the OpenShift GUI via chrome, but firefox worked fine (remember, https and 8443)
When deploying images from docker into OpenShift, don't underestimate the Pull Secrets.  OpenShift has to be allowed to pull the images from Docker.  This mechanism is intended to prevent unauthorized access of Docker images.

Declarative State Storage

***This is part of an ongoing series I call "Mode 1 Storage Guy goes to a Mode 2 World."  I'm not an expert (yet), YMMV.***

Anyone working on containers will have heard the term "declarative state" with regards to the number and type of containers.  Basically, it just means you have a platform that ensures you always have x number of containers.  In other words whenever a container dies/fails for any reason, the platform will recreate one in its place.  You're declaring how you want it to be from now on.

Say Kubernetes you tell it "I want 100 apache webserver containers" on a cluster of 10 hardware servers. It will spread 10 containers onto each server.  If you lose 2 servers, Kubernetes will re-create those 20 lost containers and spread them across the 8 remaining.*

This is very different from a Vmware-type mindset.  In Vmware you can say "deploy 100 vm's off this template," but Vmware doesn't watch the vm's, count them, and re-start them if they come down.  This is "imperative code" meaning "do what I tell you now," following a single order.

The existence of declarative state means storage has to change.  Previously, the storage layer just creates 10 LUNS, present them to the right servers, and you're done.  If the server dies, storage doesn't automatically present those LUNs to a new server, or delete them.  It sits, static, until someone comes and manually fixes it.

Luckily, in Kubernetes 1.5 there is a new concept of StatefulSets.  StatefulSets are all about enabling stability (i.e. persistence), and when combined with NetApp's powerful Trident connector it means you can create Declarative State Storage.  Which is exciting, because as far as I know I coined the phrase :-)


Declarative state storage means when a container is deleted, its corresponding volume is deleted.  When a container dies and is recreated, its corresponding volume is connected automatically.  When an application is scaled from 10 to 100 containers, the volumes are provisioned automatically.

More to come!

*In reality, Kubernetes creates a synchronous copy of each container.  So it doesn't actually re-create the container: it switches the secondary copy of the container to be primary (lowering the impact of interruption) and then re-creates a secondary copy elsewhere.  Cool stuff.

Tuesday, February 21, 2017

Virtualization, Docker, OpenShift, and Poker

***This is part of an ongoing series I call "Mode 1 Storage Guy goes to a Mode 2 World."  I'm not an expert (yet), YMMV.***

Let's say you need to see how a poker website looks from CentOS, but you have a windows box.  What you do?  Probably install hyper-v (or vmplayer), download a .iso image of CentOS, and create a new vm out of that ISO.  Contained within that VM is every dll, every file, everything CentOS needs.

OK, let's say you invented a winning poker algorithm, and you want it to play 500 games of poker simultaneously.  You don't have enough hard drive space for 500 vm's - but you have enough for 500 containers.  So on that CentOS VM you install Docker and download 1 thin CentOS container image, and Docker knows what files on the CentOS VM each container needs to run.  Docker makes it super easy to download an image in docker: docker pull  is all.

Now let's say you're making tons of money and want to get 10,000 containers playing poker.  That many images won't fit in your computer - you need more computers.  So you buy a bunch of windows computers, and on each you install hyper-v, get a CentOS VM up, and install docker.  You have your 10,000 poker games running...but one computer dies, taking down the VM and 500 containers with it.  You lose all the chips you had in those 500 games.  What's more, people are starting to copy your algorithm, and you start losing!  You improve your algorithm, but how can you change the 9,500 containers in time?

So you cluster all your computers with hyper-v.  Good first step.  And then install OpenShift on all the CentOS VMs.  Now when a server dies, OpenShift is replicating each container to another VM and you don't lose the poker game.  What's more, every time you update the algorithm, you can use docker to create a new image and have OpenShift deploy it in place of the old algorithm container after each poker game.  

Friday, February 17, 2017

OpenShift, Trident, Docker, and SolidFire: Part 1

***This is part of an ongoing series I call "Mode 1 Storage Guy goes to a Mode 2 World."  I'm not an expert (yet), YMMV.***

We have a group of NetApp/SolidFire customers already live with OpenShift on SolidFire, which is very exciting but a bit scary too.  It's a bit scary because many of these clients went live without ever chatting with us!  This means they're running into issues like having to manually create hundreds of volumes, because they hadn't heard of our dynamic volume manager, Trident.

So we're partnering with RedHat to get a local OpenShift lab implementation tricked out with all the best SolidFire has to offer.  The goal is to get OpenShift running, then move on to containerized Elasticsearch and MongoDB and all sorts of other fun stuff.

Note: YOU DO NOT need NDVP in order to install/use Trident.  We do so here only for experience and demonstration purposes.

Here's the basic layout of the lab:  
1) 3 RHEL servers running as VMs in VMware (1 master, 2 other nodes)
2) NetApp Docker Volume Plugin installed
3) SolidFire for persistent storage (great API, all flash performance)
4) Trident for the automatic volume management
5) OpenShift Enterprise (instructions) as our container platform, installed on the RHEL servers.
6) OSE has several requirements, such as Docker as our container engine


The instructions for each of these are actually really good, so I'll just elaborate on a few things for this specific workflow.
  • Start with the OSE requirements instructions.  You need to make sure you have the correct RHEL licensing to access the OSE repos or you'll hit a roadblock in a real hurry!
    • Once you get to "Configuring Docker Storage" I recommend you detour over to the NDVP instructions, where you see "iSCSI RHEL/CentOS." 
    • Complete those steps, then continue with the "Configuring Docker Storage" instructions and complete through the rest of the page.  I used option 1, presenting a LUN for docker to use as the storage pool.
  • You can then install the NetApp Docker Volume Plugin (NDVP).  
    • Note that this is where the storage expertise comes in.  You'll need to know the management and storage IP's for the SolidFire, you'll need to setup iSCSI on the RHEL servers, and you'll need to present targets from the SolidFire to your RHEL servers. 
    • Create an access group with all the IQNs.
    • If you need help, I recommend this video.  You can find your iSCSI IQN with cat /etc/iscsi/initiatorname.iscsi and then create an access group on the solidfire for it:
    • Don't forget to add the port (3260) to the iscsiadm discover command
    • sudo iscsiadm -m discoverydb -t st -p 172.21.40.X:3260 --discover
    • iscsiadm -m node -l to log into all available targets
    • fdisk -l will show whether your mounts were successful and their device names
  • Once your RHEL server has logged into each target, you're able to run netappdvp --config=/etc/netappdvp/solidfire-san.json &
    • Don't forget the ampersand.  If you just run the command, it'll appear to hang but it's actually running.
NDVP Ready to Go!
And here we go, all three RHEL servers have the OSE prereqs and NDVP installed.  Here's our first NDVP-created volume!